How a data-led approach can manage sub-field costs – Farmers Weekly
Farmers could improve gross margins by adopting sub-field cost management based on a data gathering ...
Farm support is being cut back and the replacement environmental schemes require significant management costs to maintain.
It means that even a field-by-field approach to cost management may not ensure financial margins can be sustained in the long-term.
Instead, farmers and growers are being urged to look at cost and output figures in greater detail from areas within individual fields to make more informed decisions.
This so-called sub-field approach means collecting and interpreting more data.
Hutchinsons farm business consultant Will Foyle, GSC Grays director Robert Sullivan and Agrovista consultant Lewis Butlin and precision farming manager Graeme Barrett provide tips and advice on collecting and interpreting sub-field data.
Cost control
“I am a firm believer that the easiest way to make more money on a farm is to identify where it’s being lost,” says Will.
“We don’t have to save a lot in our individual sub-field costs for them to multiply up and become a significant profit boost for the farm business.”
Farm Business Survey results suggest that farms with a carefully managed approach to cost control have better financial performance figures, says Will.
Farms in the top 25% of survey results recorded 19% higher returns per hectare and 20% lower fixed costs than average.
They were, however, spending 7% more on variable costs than average.
But the better output made this a worthwhile investment and suggests careful input targeting to improve margins.
“This is an important reminder that when we take a more detailed approach to managing production factors, we are not necessarily cutting costs,” says Lewis.
“Instead, we are using the data to pinpoint where the optimum use of an input can improve margins.”
Data-led approach
In the past, when farmers and growers have wanted to estimate production, they have used published averages for inputs and likely outputs.
“But this is not sufficiently accurate – there is an infinite number of variables and two apparently identical farms can produce two completely different profit levels,” Graeme says.
There are always fields that have productive areas and those with patches, possibly caused by shade, soil type or moisture levels, where yields are lower, he says.
So we now need to investigate these by collecting data to see what role they are playing in the overall gross margin and whether we can improve or perhaps even need to remove them from production.
Although sub-field costs might be a step-change in farm management, it is not difficult to monitor costs – there are tools that make the job much simpler and the time invested can be worthwhile.
Data collection services
Data collection and analysis can also be carried out without investing in kit by companies and consultancies.
For example crop nutrition specialist Omex Agriculture collects data, provides nutrient analysis and offers advice.
The days of applying nutrients in the same ratios and at the same rate as an annual operation must soon be consigned to the history books, says Omex Agriculture’s national agronomy manager Scott Baker.
The increased risks of pollution through leaching and to the environment from emissions via volatilisation, are too great.
Aside from this – it is a waste of money to over apply nutrients.
To establish what the growing crop requires, the company requests farmers collect data from locations using GPS plotting.
This ensures that subsequent tests can be taken from the same spot to provide comparable data.
Testing is then either through a tissue test or a rapid-response, plant sap testing technique.
The tissue test samples the entire plant to provide an overview of how the plant has grown through the season while a sap testing process provides a snapshot.
This test draws sap from leaf samples that are analysed in a lab to provide a nutrient profile of the growing crop.
The sap test results are fed back to the grower within 72 hours along with an advice sheet on any actions.
By measuring the data it reduces over- or under-application of nutrients allowing optimal growth and improved gross margins while cutting emissions and pollution risks.
Interpreting data
Collected data can be plugged into software packages – either on farm or through consultancies – that will overlay data and produce detailed analyses of sub-field margins.
“Clients who have begun soil sampling and provided us with the data often don’t believe the recommendations that we can make on the back of the results,” says Lewis.
“Some have seen fertiliser applications cut by two-thirds in year one.”
Hutchinsons consultants apply data through the Omnia software package.
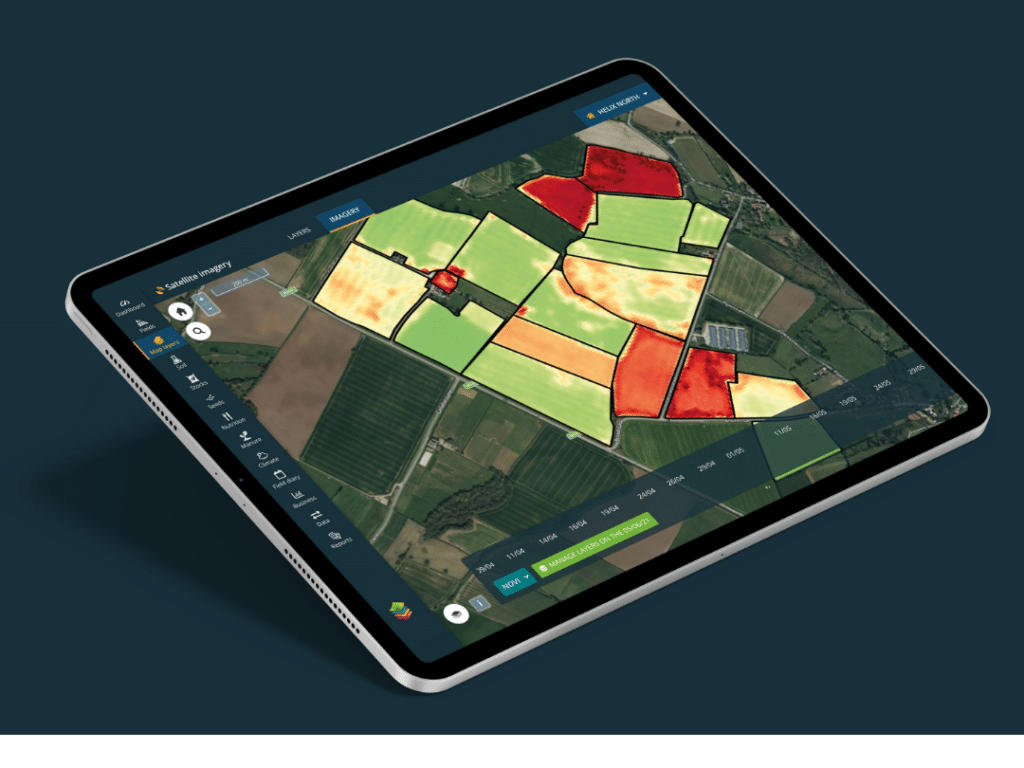
The tool can import existing data such as previous yield maps, soil scans, and stored figures on Normalised Difference Vegetation Index (NDVI), a measurement of the quantity and health of standing vegetation.
It can then combine this with new field data, cost and return statistics and overlays the information on a map.
The result is a visual representation with a profit and loss level mapped across the sub-field areas.
Yield monitoring
Modern forage harvesters have yield monitors so silage or maize fields can be approached in exactly the same way, suggests Graeme.
Data can be useful to identify areas suitable for third cuts and those which are better suited for aftermath grazing.
For arable farms, software packages can look at how the various crops in a rotation perform in a particular part of a field.
What does each area yield, how does input use compare and what do they contribute to the margins from that field – do they add or detract, says Lewis.
Some areas may be costing money year-in, year-out, others may contribute a positive margin depending on the crop, he adds.
For example, heavy soils and shaded areas on headlands may still provide a margin for a wheat crop in a particular field.
Traditionally, a following bean crop will most likely have been drilled over the same area.
But, more detailed yield and cost data can show that the beans might not yield a margin on those trickier areas and an alternative strategy could be put in place for that part of the field, suggests Will.
Perhaps, an option under a stewardship scheme that will yield a payment from a lower input cost could be used.
With the background data pointing to variability in nutrient or yield levels, investing in machinery that can meet those differing demands could be worthwhile.
Variable-rate seed drills, fertiliser and slurry spreaders can be used in conjunction with data to match soil variability, points out Robert.
Drills can be set for optimal plant density, leading to better yields and potentially reduced seed use, he says.
Likewise, fertiliser spinners can be set up to provide precise applications of nutrient levels to meet changing deficits and surpluses across the field.
“It is possible to save virtually half the cost of P and K, from a variable-rate fertiliser spreader that can be bought for as little as £1,500,” Graeme reckons.
Underlying issues
In some cases, the data may point to an underlying physical issue that could be addressed.
A poorly yielding area within a field may point to something rectifiable such as a blocked drain.
Restoring the yield potential may be as simple as taking a spade to unblock a culvert, says Lewis. Other results may lead to more wide-scale strategic changes in land use.
The long-term strategy for most farm businesses is to expand. But this may not be the most sustainable approach.
Data may highlight areas where land is too poor to warrant continual, costly input to address deficiencies.
In these cases, the data might suggest it is better to stop wasting inputs, remove the area from production altogether and enter a long-term scheme or access private funding for a natural asset.
With the capital freed up by the cessation of activity on a farmed area, it might be possible to purchase a block of higher quality land elsewhere that could generate better margins, Robert suggests.
Alternatively, removing land might facilitate a downscaling of costly farm machinery and equipment levels.
Money raised could be invested in another venture with a potentially higher return.
Case study: Transition Farmer Andy Bason
Hampshire-based Transition Farmer Andy Bason and his team collect data from across the 800ha arable unit to help maximise margins.
Key among the data-capturing equipment is a new Claas combine.
The yield monitor on the Claas combine is a vital piece of equipment that feeds back valuable information on productivity, says Andy.
This is backed up by satellite imagery providing Normalised Difference Vegetation Index (NDVI) data to provide a measure of crop density and health.
The team at Newhouse Farm also have an NDVI sensor on the sprayer that produces results to cross-reference with the satellite imagery.
From there, a detailed map is produced to support decisions on fertiliser applications.
Soil testing
Soil testing is another key operation that underpins the decision-making process.
As experienced farmers, the team know how the soil types change across the fields, but the detailed testing results are an important aid.
Test results are fed into the variable-rate seed drill to control plant densities that meet the soil type and field characteristics.
Other data are added, including areas that are prone to slug damage, weed burdens and rabbit damage to help fine-tune seed rates.
Since the start of this year, the farm business has signed up to use the Omnia software platform.
It’s early days with the software package but the map-based visual representations are helping to plan N applications and Fibrophos spreading to supply the P and K fractions based on the soil maps, Andy says.
The variable and fixed costs can then be fed into the software and an algorithm generates figures to arrive at a gross margin per hectare figure.
Variable costs are relatively simple to collate and apply to the system. However, fixed costs are more difficult to break down, says Andy.
“We benchmark with other farmers who similarly find it trickier to get a good grip on fixed costs. It’s a process we are determined to get on top of though, so that we can plug in more data and come to an even more accurate result.”
Farm facts:
Newhouse Farm, Northington Down, Alresford, Hampshire
- Farm size: 800ha main farm
- Annual rainfall: 770mm
- Soil type: Loam